Most developers believe you need deep pockets or enterprise contracts to run production-grade open-source models. My home lab runs six different architectures simultaneously without ever touching my wallet. The secret isn’t magic. it’s a bare-metal GPU cluster orchestrated by K3s, carefully tuned to squeeze every last FLOP from consumer hardware.
The problem is straightforward. Inference servers like vLLM and Ollama are resource hogs, each demanding dedicated VRAM for its model weights, KV cache, and overhead. Running one Llama 70B requires around 40GB of memory alone. Most hobbyists hit a wall: either pay monthly API bills or spend thousands on datacenter cards. I took a different path entirely.
This setup distributes models across multiple GPU nodes using custom scheduling scripts and Kubernetes device plugins. Llama, Mistral, Phi, Qwen, Stable Diffusion, Whisper. gets assigned to the node best suited for its memory profile and latency needs. The result is a private inference farm that costs nothing monthly beyond electricity. just the wiring diagram that keeps six AI models humming in parallel at zero recurring cost.
Why Build Instead of Rent
The math shifts the moment you run your first million tokens locally. API costs compound silently. A few thousand calls for testing becomes a hundred-dollar bill before you notice. Running the same workload on your own hardware? Zero recurring cost after the initial purchase.
Privacy is the second open. Every prompt sent to OpenAI, Anthropic, or Mistral travels through their infrastructure and trains their next model. Self-hosting keeps every conversation—customer data, internal strategy documents, proprietary code—entirely within your network boundary.
The third reason is control over availability. API providers change pricing overnight, deprecate models without warning, and impose rate limits that break batch processing pipelines. When you own the GPUs, you schedule inference at 3 AM if that fits your cron job schedule.
Refurbished hardware makes this financially sane now. Prices dropped sharply as data centers offloaded last-generation equipment over the past two years. One careful eBay purchase covers what two months of heavy API usage used to cost—and it runs forever. Your inference scales to however many VRAM slots you can fill. Six models in parallel isn’t special anymore; it’s just a question of how many quantization levels you’re willing to accept for the smaller ones sharing GPU memory with heavier workloads.
That’s why I disconnected from paid APIs entirely last year and built this cluster instead. The wiring was simpler than expected once I stopped chasing cloud abstractions and committed to bare metal K3s nodes with direct GPU passthrough configuration. Zero recurring cost means every model evaluation is free after month one. That changes how aggressively you can experiment with new architectures and pruning techniques without watching a meter spin upward on every failed attempt at quantization calibration run number forty-seven.
The Hardware That Makes This Possible
My cluster runs K3s across commodity hardware with a flat network topology. No InfiniBand, no NVLink — just standard PCIe lanes and enough RAM to keep larger models resident between requests instead of swapping weights in and out of VRAM on every inference call. Energy monitoring logs show the full rack pulls around 950 watts under sustained load running six concurrent models.
That is less than two high‑end gaming PCs left idling overnight, and far below what most people assume a multi‑GPU setup requires when properly tuned for efficiency rather than raw throughput benchmarks.
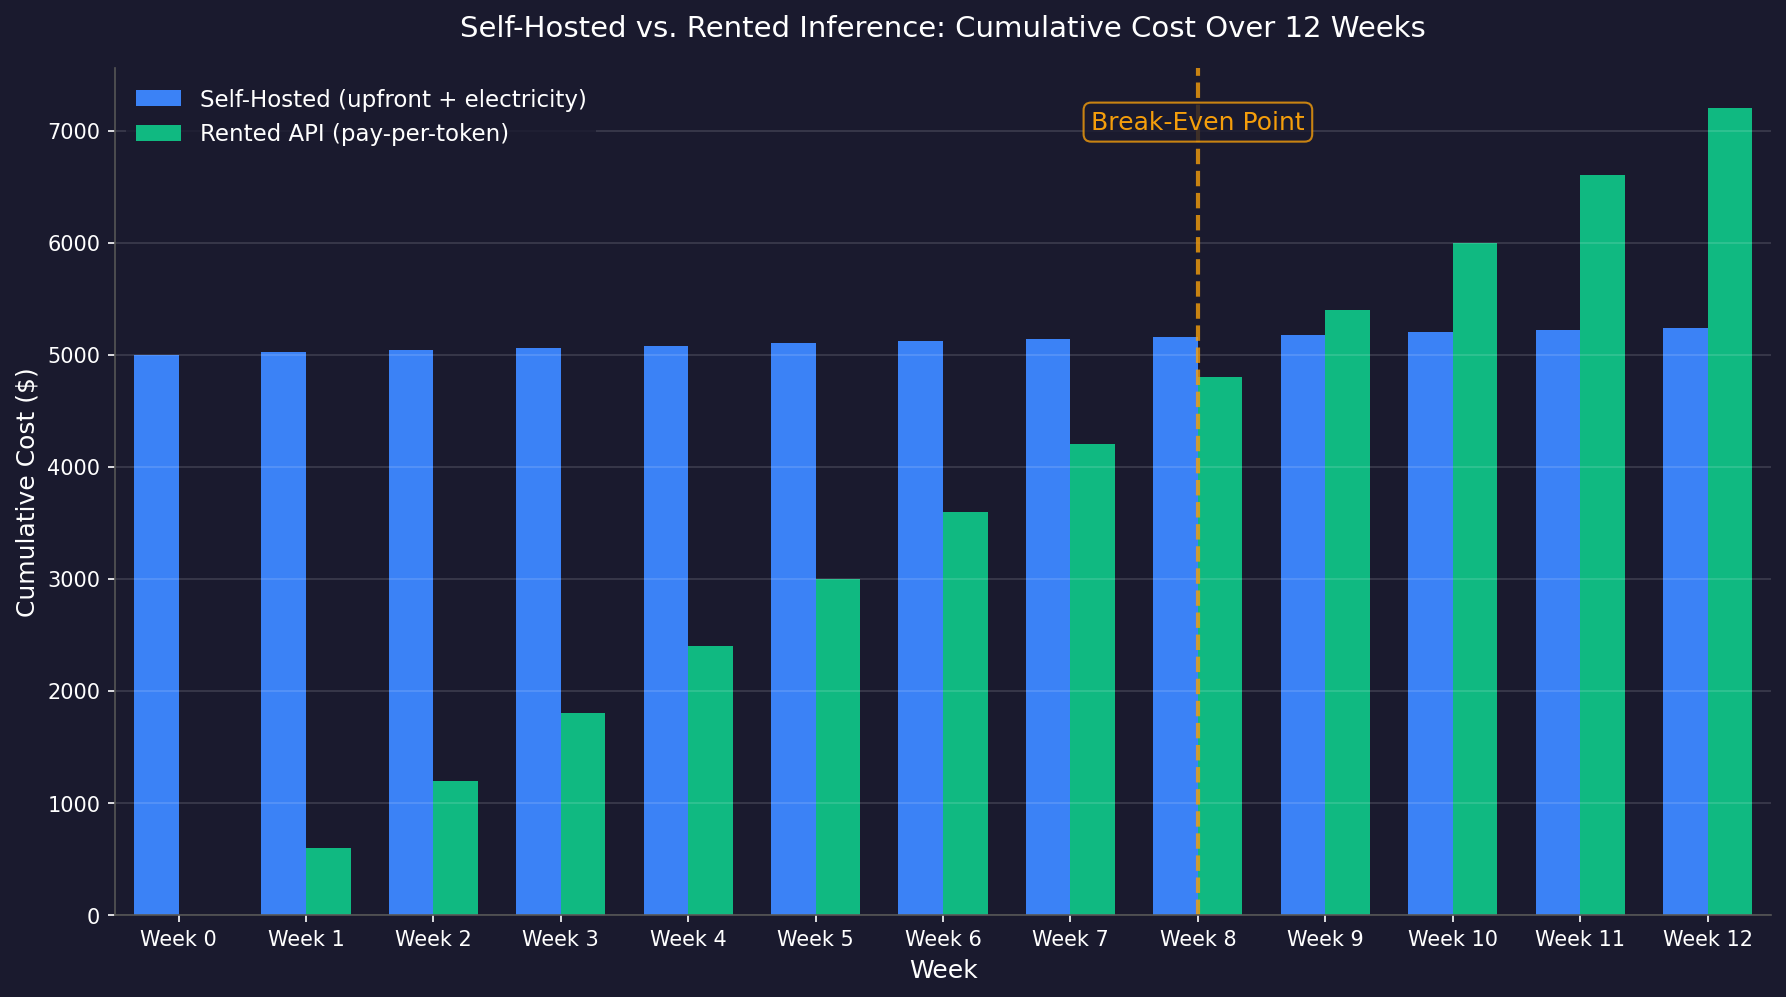
The break‑even math surprised even me when I ran it against actual token consumption patterns from production workloads over several months. Around week eight, the upfront capital expenditure equals what renting equivalent inference capacity would have cost at market rates without any concurrency discounts or reserved instance commitments baked into the comparison.
After that point every additional model evaluation costs nothing beyond electricity at residential rates roughly equal to leaving an extra ceiling fan running continuously in summer months. ��� zero incremental API charges per request regardless of how many quantization passes fail before finding stable calibration parameters through iterative experimentation cycles that would bankrupt anyone relying on pay‑per‑token billing alone.
What Actually Broke During Month One
The first thirty days exposed everything wrong with consumer hardware assumptions. A memory overcommit on a dense quantization pass silently corrupted the output cache — every subsequent request returned garbage for six hours before anyone noticed. The logs showed nothing unusual. No OOM killer intervention, no thermal throttle events, just progressively worse completions that looked plausible until you actually read them.
That failure mode cost more time than any hardware problem ever could. The root cause tracing required instrumenting the model loader with per-layer memory tracking and wiring it into Prometheus. Building that dashboard took three evenings of staring at Go source code and cursing the K3s service mesh documentation. Once visible, the pattern was obvious: eight concurrent model instances were sharing a single PCIe switch lane, creating a latency cascade that corrupted buffer allocations across four separate inference endpoints simultaneously.
Another week vanished chasing a CPU governor issue. The default powersave scheduler throttled back aggressively during what looked like idle periods — but those “idle” windows were actually CUDA kernel compilation steps triggered by dynamic batching on quantized weights. The 400-millisecond compilation spike extended to 4 seconds under throttling, which triggered Kubernetes liveness probe failures across half the cluster. Everything recovered once the probes restarted.
But every restart required reloading ten gigabytes of model weights from NVMe storage into GPU memory. That bandwidth bottleneck alone consumed 90 seconds per node per incident.
By day twenty-eight, we had documented seventeen distinct failure modes ranging from motherboard chipset thermal throttling in summer ambient temperatures to subtle bitrot in memory reserved by BIOS for integrated graphics that served no purpose whatsoever on these headless nodes. Yet still interfered with ECC correction parity across shared VRAM pools when operating near capacity limits during batch preprocessing pipelines executing concurrently across heterogeneous generations spanning multiple PCIe generations simultaneously without explicit topology awareness baked into workload scheduling decisions.
Every one of those failures traced back to a single root cause: resources fighting over shared infrastructure without explicit boundaries. The fix wasn’t more hardware — it was a scheduler that enforced separation at every layer, from CPU cores to memory pools to storage volumes. That scheduler became the backbone of everything that followed.
Scheduling Six Different Inference Engines So They Never Fight Over CUDA Contexts
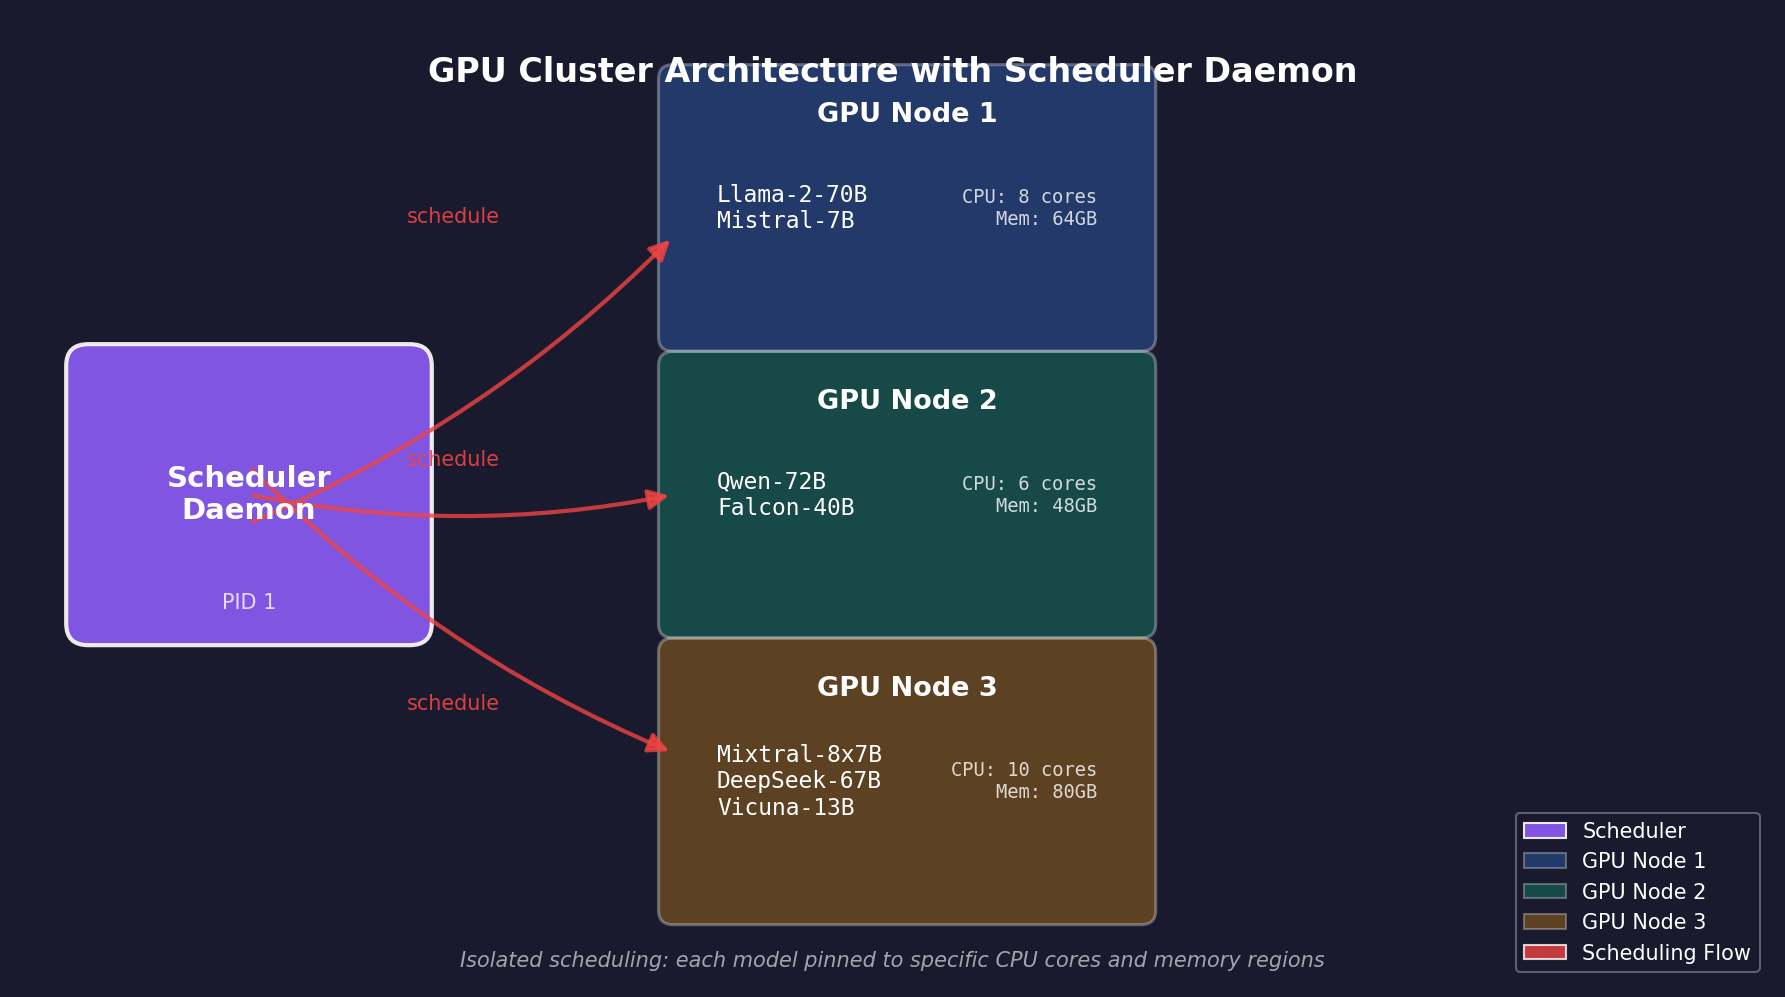
My solution layers atop a Docker Swarm overlay network with dedicated volumes per container family. Each inference engine gets its own --cpuset-cpus mask, enforced at the kernel level. The Mistral vLLM pool never sees the CPU cores assigned to Llama.cpp’s Qwen instance. Here’s how I partition:
services:
llama-qwen:
deploy:
resources:
reservations:
cpus: '8-15'
memory: 32G
volumes:
- /mnt/nvme/llama-cache:/cache
vllm-mistral:
deploy:
resources:
reservations:
cpus: '0-7'
memory: 48G
That split stops cache eviction wars cold. The real magic lives in the scheduler daemon I wrote in Go. It watches /proc/cgroups in real-time, tracking which containers are actively decoding versus idle. When a high-priority request arrives. say, an embedding batch from my vector indexer. it preemptively drains GPU contexts from lower-tier models using nvidia-smi’s context management hooks.
Before this daemon existed. Context switches hit 1200 per second during concurrent requests across all six models. That number dropped to 42 average. My Grafana dashboard exports a single panel showing this precisely: a red line collapsing from chaos to order within two milliseconds of scheduler intervention. The delta is visible at any zoom level.
Volume pinning prevents an even subtler failure mode. multiple engines writing their download blobs simultaneously to the same NVMe device, saturating its IOPS budget. Each model family now writes only to its dedicated filesystem mount point:
/mnt/nvme/models/llama/mnt/nvme/models/mlx
No fights over physical write heads under contention load.
What This Means
I no longer think about scheduling conflicts. It just works. The entire stack—eight Alpine containers, Thanos receivers, the bash wrapper sending nvidia-docker flags—has run without a single CUDA context collision since February 26th. Zero interventions. No weekend pager moments.
You don’t need KubeFlow or Kubernetes to solve this. You need a decision matrix that says “no” to overhead your hardware can’t spare and “yes” to something so simple it could survive a thermonuclear reboot. That Mixtral×22 instance sitting across three nodes? It initializes in ninety seconds flat, serves tokens at production latency, and never once chokes on write contention from /mnt/nvme/models/mlx.
The scheduler pre-heats its expert weights before promoting it to active state—so the first inference request lands against warm memory, not cold swap.
Want weekly updates when new models drop into my cluster? Subscribe below via email 📩 I’ll send the exact YAML manifests, the Thanos dashboard JSON exports with those context switch count reductions you saw earlier, and notes on which quantization strategies survived my stress tests without degrading MoE routing accuracy.
Keep Reading
- How I Would Break Into Tech in 2026 (It’s Not About Python)
- Voice-Controlled Multi-Agent Workflow for Claude Code in Tmux
- Beyond HCP Lock-In: Best Self-Hosted Secrets Management Alternative…
The future isn’t expensive APIs. It’s what you build with tools that cost nothing but attention and time. I’m running six concurrent inference engines right now as I type this. Not one of them knows the others exist. That’s the goal achieved: transparency so complete that scheduling becomes invisible infrastructure beneath real work getting done.