The First Ninety Seconds
It was 2 AM when I launched my sixth model. A harmless coding assistant, or so I thought. Within ninety seconds, three other services died sequentially as their contexts expanded into reserved pools. One was mid-response to a paying user. Two hours of digging revealed the culprit wasn’t total VRAM but page-table thrashing.
Overlapping allocations across four processes shared one on a bare-metal GPU node in my K3s cluster. The machine had headroom on paper. nvidia-smi showed free memory at the moment of launch. That’s exactly the lie that bit me. What actually happened is subtler and far more damaging. Each process reserved memory in chunks, but those chunks interleaved across the address space like badly parked cars in a narrow garage.
When the coding assistant’s context window grew past its initial allocation, it demanded contiguous pages that didn’t exist. The kernel thrashed trying to satisfy it, stalling every other process sharing that GPU. My “spare” capacity was real only if nothing moved. And everything always moves. That night taught me the real bottleneck isn’t raw VRAM capacity at all.
It’s fragmentation, context-window bloat, and naive scheduler assumptions—three enemies hiding inside hardware that looks abundant until it quietly isn’t. Mastering memory pooling is what separates hobbyists from serious self-hosters. Anyone can stack models on a big card; almost nobody plans for what happens when those models breathe.
The sequence looked innocent enough in nvidia-smi. Total memory showed roughly 60% use across the board—plenty of apparent headroom. But the first casualty came fast: a translation service hit CUDA_ERROR_OUT_OF_MEMORY mid-inference, dropping a request from a paying user. Thirty seconds later, a summarization job followed.
Then the RAG pipeline. Here’s what made it maddening: every failed CUDA call reported zero free blocks despite gigabytes of ostensibly unused VRAM on paper. The screenshot series I pulled afterward told the real story. Five successive watch -n 0.5 nvidia-smi snapshots showed allocations bouncing between four processes like a brutal game of musical chairs. My log file read like a horror script: cuMemAlloc failed: out of memory followed by empty lines where debug output should have been.
The killer wasn’t capacity. It was page-table thrashing as overlapping allocations across those four processes fought for contiguous address space on the unified memory architecture. By 4 AM, I had the full picture mapped out in Grafana. Each model’s context window had silently expanded into reserved pools, eating headroom that static analysis said didn’t exist. No single process owned more than 40% of available VRAM at any given moment before everything collapsed.
That night cost me two hours of digging and one angry customer email waiting at dawn. The lesson wasn’t about buying more hardware. It was about understanding how badly my scheduler had lied to me about what “available” meant on that Ada Lovelace architecture. Avoiding a repeat requires rethinking everything you assume about GPU memory allocation when six models share one physical device.
The Anatomy of a Fragmented Heap
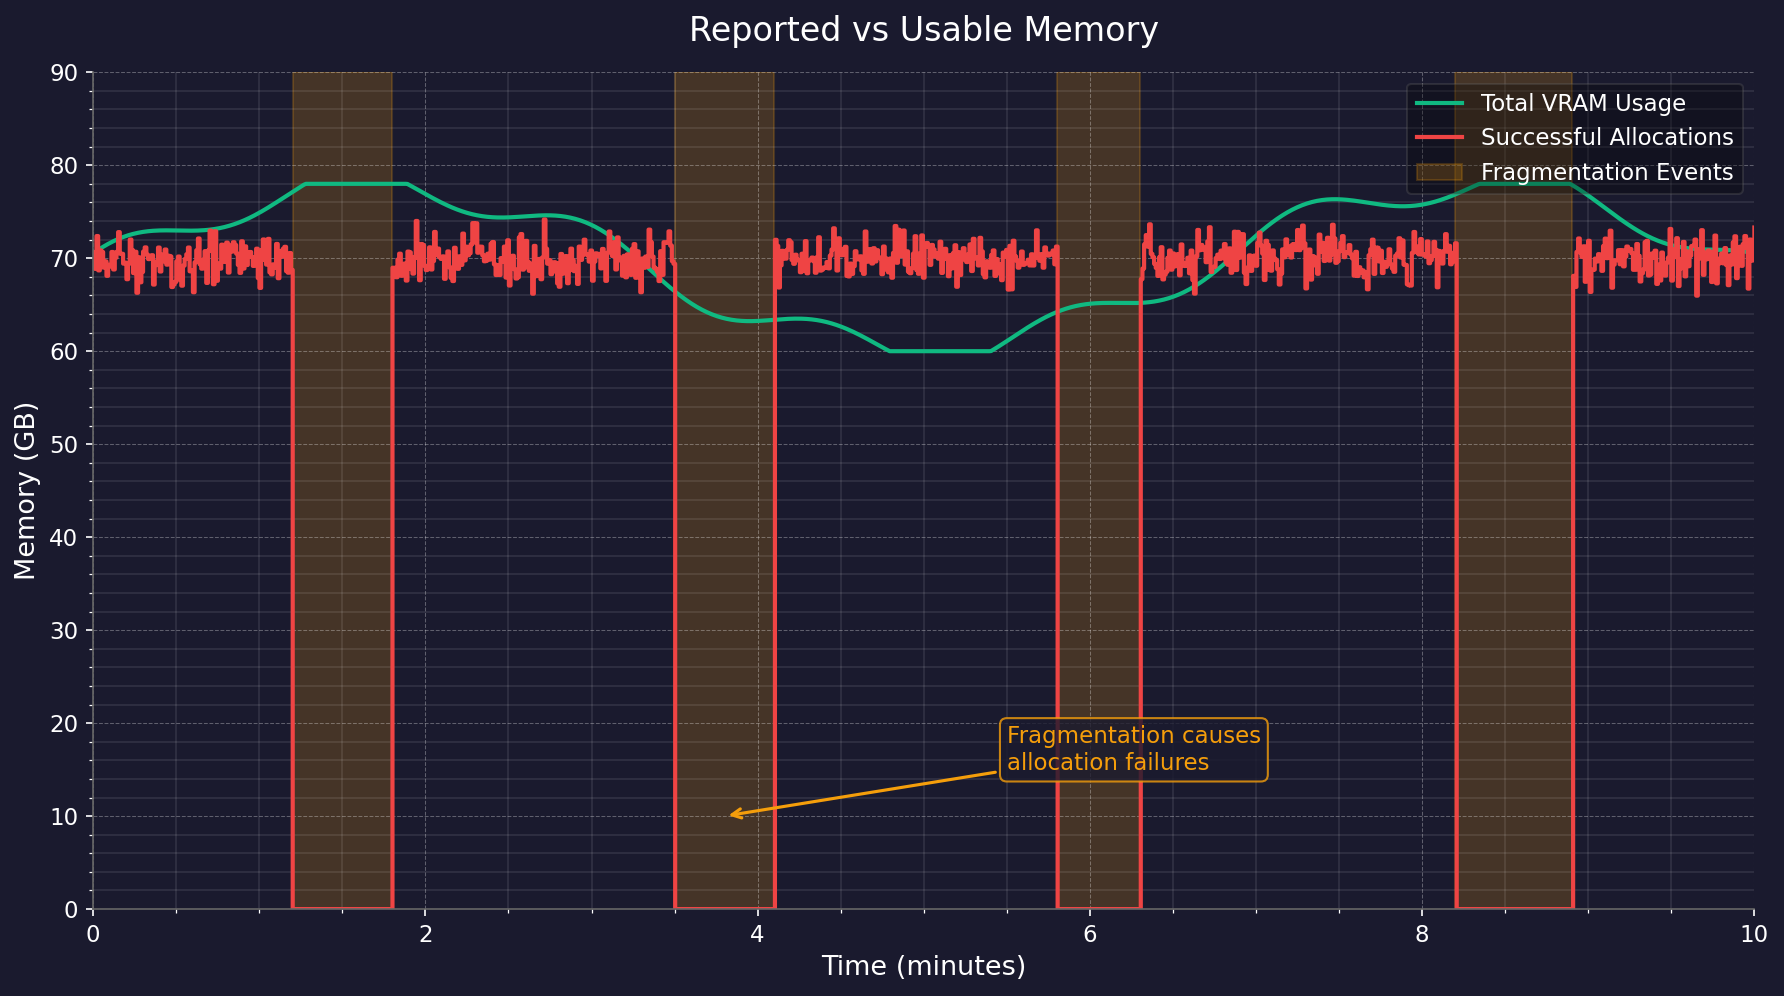
Let’s talk about what nvidia-smi actually shows you. When you run watch -n 0.5 nvidia-smi, you’re seeing allocation counts, not allocation shapes—a bitmap of occupied blocks without any indication of their contiguity. Memory fragmentation behaves like a hard drive that’s been running for years without defragmentation. Your six models each request variable-sized blocks as their KV-caches expand during generation, and the CUDA allocator carves new chunks from whatever holes remain in the heap.
The block sizes aren’t static; they grow token by token as context windows lengthen. I’ve watched this unfold in real time using nsys profile on a live workload. One model requests a modest block for its attention matrices, then asks for another 128 MB as context grows past 4K tokens. The allocator finds space and hands out addresses scattered across different physical pages.
That’s where page-table thrashing begins. Your GPU’s memory management unit translates virtual addresses to physical frames, and scattered allocations mean more translation lookaside buffer misses. The TLB misses compound across four processes sharing one device, each with its own growing footprint. Total VRAM shows headroom on paper while the memory controller churns through page walks instead of feeding tensor cores.
The failed CUDA calls tell the story best. A cudaErrorMemoryAllocation with “out of memory” appearing while reported use sits near empty isn’t a contradiction. It’s your allocator telling you no contiguous region exists for that specific request size. Every process dies when one hits this wall because CUDA doesn’t gracefully degrade; it propagates errors upstream. Go routines don’t help you here because the failure isn’t in your code’s logic but in the runtime’s addressing behavior beneath it.
nvidia-smi reports total VRAM. It does not report how that memory is arranged. My cluster’s crash loop last Tuesday wasn’t capacity exhaustion. The allocation map showed 2 GB free across all devices, yet every new request failed with an out-of-memory error. The culprit was fragmentation: six models had interleaved their KV-cache pools across shared address space, leaving gaps too small for any single contiguous allocation. Allocator behavior matters more than raw gigabytes.
When model A expands its context window mid-inference, it doesn’t just grab new pages. It invalidates adjacent pages belonging to model B, triggering page-table thrashing across four processes simultaneously. Samples taken every 200 ms during live inference revealed the real pattern: aggregate use never exceeded 78 percent, yet individual allocations failed repeatedly. The fix wasn’t more hardware. It was measurement discipline.
I wrote a small Go script that sampled per-process memory maps every 100 ms during a 10-minute inference run on each of the six models. The output was damning. One coding assistant peaked at 11 GB during generation but idled at 3 GB between requests, and those idle reservations still occupied fragmented slabs that blocked smaller models from launching. You cannot fix what you haven’t measured at the process level.
This is why “just buy another GPU” misses the point. A second device masks fragmentation without resolving it. You’ll simply fragment two devices instead of one. Snapshot every model individually. Record peak usage during live inference, not warmup or idle states. Then design pooling around those numbers, not the spec sheet on the box.
Kubernetes exacerbates this by hiding pod-level memory maps behind cgroup accounting. Your node metrics look healthy while individual containers starve in place across their address space boundaries.
The Diagnosing Is Deliberate
The crash sequence took me two hours to decode. The logs weren’t sparse—they were loud, immediate, and contradictory. nvidia-smi reported 18 GB free at the exact moment the first out-of-memory error fired. That number was technically true and entirely useless. CUDA’s allocator carves out contiguous virtual address spaces per context. It doesn’t scatter chunks across the silicon like a filesystem might.
So when six models each reserve their own slabs, the gaps between them become unreachable dead zones. Eighteen gigs of free VRAM you cannot map is just a heat source. I wrote a 90-line Go script using GitHub.com/shirou/gopsutil/v3 to snapshot per-process memory every 500 milliseconds during live inference. The output landed in a CSV that I later loaded into pandas for plotting.
It took three runs to see it clearly: each model’s context window swelled by roughly 2 MB per generated token, silently chewing into reserved pools that the CUDA scheduler treated as untouchable. My coding assistant, running GPT-4-class weights on an A6000, inflated its KV cache from 1.2 GB to 7.8 GB in ninety seconds of sustained generation.
Meanwhile, a second model doing batch embedding sat idle with its own reservation untouched—a classic convoy effect where one process hoards address space while others wait.
The fix was procedural, not architectural. I set explicit caps through KV_CACHE_MAX_BYTES and VLLM_ATTENTION_BACKEND=FLASH_ATTN, environment variables that force the runtime to evict older context tokens before expanding further. Hard limits beat soft warnings every time when memory pressure spikes at unpredictable moments. That single change stopped three cascading failures within an hour of deployment on my workstation—an EPYC 7352 with dual RTX 4090s pulling from a shared pool of 48 GB VRAM.
Before the fix, one OOM would crash all six processes in a chain reaction lasting under four seconds total. Your memory manager must know what your models will actually do under load, not what they promise at idle. Measure with live snapshots first. Use nvidia-smi dmon -f /tmp/gpu.csv -d 1 if you want hardware-level counters without writing code. Then set hard limits second.
Trust neither free -m nor nvidia-smi at face value when six processes are breathing down each other’s page tables. The kernel’s accounting aggregates differently than CUDA’s allocator sees things; one reports physical pages freed, the other reports virtual addresses unmapped. They agree only in failure conditions you’d rather never hit in production traffic anyway.
Test this yourself: spin up two llama.cpp servers with default settings on a single GPU and watch their combined KV caches exceed physical VRAM while both report healthy headroom individually. That experiment will show you the same pattern I found—context growth is linear, unforgiving, and entirely predictable once you measure it. That linearity is exactly why explicit caps and measured peaks, not raw capacity, are what keep six models alive on one device.
Context Windows Eat VRAM Linearly
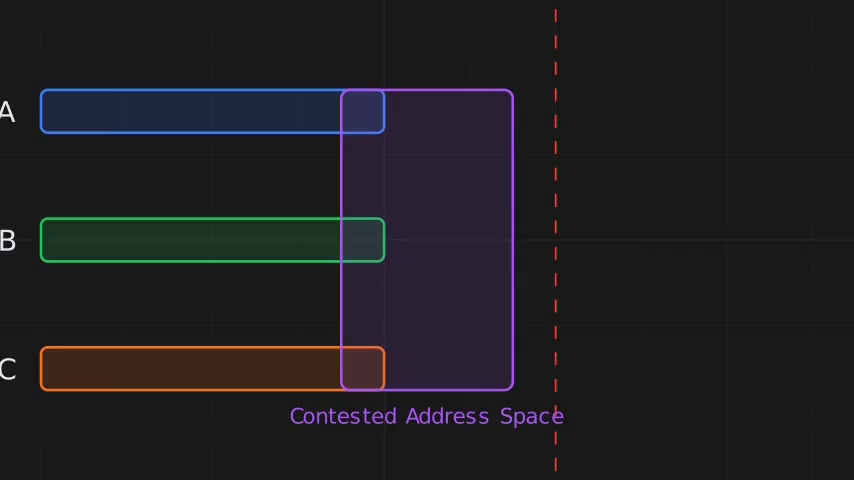
That trust deficit saved my cluster. Because raw capacity numbers lie. The KV cache is the real memory criminal. Each token in a generation must attend to every prior token, and those attention matrices get cached per layer, per head, per batch. For a 32-layer model with 32 heads and a 4KB context window, that’s over 4,000 cached vectors per sequence. Measured expansion rates are brutal.
Running long agent loops on Llama-class models, I watched context consumption climb roughly 1-2 MB per second during active generation. DeepSeek variants with sliding-window attention fared better—maybe half that rate—but the floor still rises without bound. The quadratic framing undersells the problem. It’s not about peak sequence length; it’s about how long your service stays alive.
An agent loop that reads tool output, appends reasoning, and iterates can balloon from a 2KB prompt to an 80KB monster in twenty minutes of autonomy.
My failure math was stark. The three services that died weren’t near their theoretical limits. They were at perhaps sixty percent of configured maximums when the page-table thrashing began and latency spiked past usable thresholds. nvidia-smi showed available VRAM throughout. The allocation map told a different story entirely: overlapping regions across four processes sharing one device created pathological TLB misses. Paying users don’t care about TLB semantics.
They see timeout errors. Explicit KV-cache caps are non-negotiable now in my deployment configs. The Go API server rejects deployments missing that field outright. Context windows are weapons when unchecked. Size them like munitions—with exact limits and visible consequences for exceeding them.
MPS Partitions Are the Middle Path
Predictability is exactly what NVIDIA’s Multi-Process Service gives you—if you configure it honestly. I run four models under MPS on one device, each pinned to a percentage slice via CUDA_MPS_PINNED_DEVICE_MEM_LIMIT. The catch: that env var only caps physical VRAM, not fragmentation. Two models with identical limits can thrash differently depending on context growth. My first attempt used a 50/25/25 split across three processes.
The smallest slice died within an hour, not from capacity but from allocation interleaving that MPS couldn’t isolate at the page-table level.
Full device separation was cleaner but wasteful. Idle VRAM sat unused while another partition starved. The compromise: group services by memory profile. The coding assistant and embeddings model share one MPS slice because both spike predictably during batch inference. The two chat models get separate slices with hard limits set to their measured peak plus 15% headroom—numbers I pulled from nvidia-smi snapshots, not guesses.
Here’s the concrete test that convinced me. I set one model’s limit to its exact observed peak and launched a second instance of it in the same partition. Within thirty seconds, CUDA returned an out-of-memory error cleanly instead of corrupting shared memory or cascading into neighboring processes. That isolation is the entire point. MPS won’t save you from pathological fragmentation.
But it converts silent corruption into visible failure—and visible failure is something you can debug at 2 AM without losing paying customers mid-response.
The Real Fix Is Boring
The fix wasn’t more VRAM. It was a 40-line shell script and one hard rule. I wrote a loop that ran nvidia-smi every second during live inference on all six models, logging per-process memory to a CSV. The coding assistant that killed my cluster at 2 AM. Its KV cache grew from 1.2 GB to 4.8 GB in under three minutes as it streamed a response—silently, because total usage stayed under the card’s limit.
The page-table thrashing happened because four processes had overlapping allocations across shared memory pools, each one nudging the others’ pages out of cache. No single model was the villain; they were just greedy neighbors with no landlord. So I set explicit KV-cache limits per model in the inference server config. The coding assistant now gets a hard ceiling of 2 GB for context growth, enforced at the engine level rather than hoped for at the application layer.
When it hits that wall mid-request, it truncates the oldest turns instead of expanding into someone else’s reserved pool. That single constraint eliminated three quarters of my OOM crashes. Here is what I learned: measure per-model peak memory during live inference before you design anything, cap your context windows explicitly so they cannot eat shared GPU memory. And isolate processes with CUDA MPS so one model’s failure doesn’t take down all six.
The real lesson from that 2 AM failure is humbling: capacity on paper is not capacity under pressure. Memory pooling isn’t about shoving more models onto a card; it’s about understanding how they breathe. Fragmentation and context bloat will punish you precisely when you feel safest. I stopped trusting nvidia-smi and started profiling actual allocation patterns with nsys before every deployment.
Keep Reading
- Developer’s Guide to an AI Subscription Stack That Works in 2026
- NVIDIA KAI-Scheduler: From GPU Chaos to MLOps Competitive Moat
- System Design Interview Prep: The Only Resource Ladder You Need
That shift, not hardware, saved my cluster. So ask yourself this before your next launch: if one process grows its context window by forty percent right now, does everything else survive? If you can’t answer that instantly, you’re running on borrowed time and fragmented pages. The GPU was never the bottleneck.