Start With a Crash
Your application goes down at 2 AM. You wake up, SSH check the logs, restart the process. That approach doesn’t scale to ten services. At some point, you’re not an engineer anymore — you’re a very expensive cron job. I run a bare-metal cluster with K3s at home. Nothing fancy — just enough hardware to run Go services and MongoDB without renting cloud boxes. Before Kubernetes, every failure meant context switching.
Here’s what most managers don’t realize: server utilization averages around 15–20 percent in typical setups. That’s five machines running at one-fifth capacity because each hosts exactly one service and can’t share resources when something spikes elsewhere. The real problem isn’t crashes though. It’s idle compute wearing out hardware for nothing.
Manual recovery worked fine when your company had three microservices and a monolith on AWS EC2. But once deployments pass double digits, human response times become the bottleneck — not CPU or memory limits. You need something that notices when a process dies and starts another before coffee gets cold. That’s where orchestration enters the conversation, whether you call it Kubernetes or something else entirely.
Let me give you a concrete example from my own infrastructure. I run a small fleet of Go services — an API gateway, a background worker that processes image resizing jobs, and a metrics collector that scrapes Prometheus endpoints every 30 seconds. Before I moved to K3s, each service lived on its own VM. The API gateway sat at 8% CPU utilization most days, spiking to 70% during morning traffic.
The background worker idled at 3% until a batch job came through, then pegged all four cores for twenty minutes. The metrics collector never exceeded 5%. Three machines, three power supplies, three sets of OS patches to maintain, and roughly 85% of that compute sat completely unused at any given moment.
When the API gateway crashed — which happened twice a month, usually during a memory leak I hadn’t caught in testing — I’d get paged, pull up my laptop, SSH into the box, check journalctl for the panic trace, and restart the systemd unit. That’s fifteen minutes of my night gone, assuming I was awake and near a terminal. If I was traveling or asleep, it stretched to an hour.
The service was down for an hour because one process died. That’s being a human cron job with a pager.
The fix isn’t more monitoring or better alerting. The fix is making the system self-healing so the alert never fires in the first place. That’s what orchestration gives you — not just deployment tooling, but a control loop that constantly checks whether reality matches your declared intent.
What Kubernetes Actually Does

The core abstraction is the Pod: one or more containers that share networking and storage. A Pod gets an IP address, some CPU shares, memory limits, and—critically—a health probe path like /healthz that Kubernetes checks every 10 seconds by default. But here’s where the magic hides from casual observers. Kubernetes doesn’t just run things; it reconciles reality toward intent. If your YAML says “three replicas” but two crash, Kubelet restarts them automatically. If all three die?
The ReplicaSet controller creates new ones elsewhere on the cluster within seconds.
This reconciliation loop runs on every node via kubelet. Each kubelet polls its local API server endpoint, fetches its assigned Pod manifest, and checks if the running state matches it. Mismatch means action: kill the old one, start the new one. The scheduler handles placement decisions using taints and tolerations rather than hardcoded machine names. You can say “only run GPU workloads on nodes with gpu=true label” without ever editing a deployment file again when hardware changes beneath you.
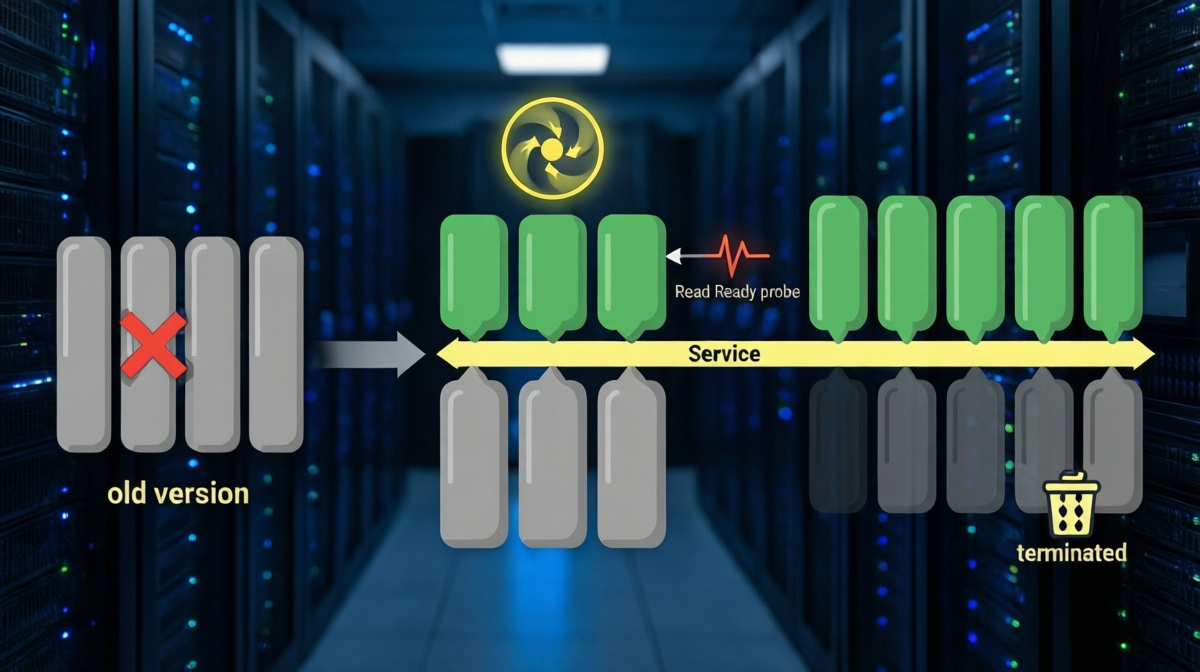
Services provide stable networking addresses despite Pods dying constantly underneath them. A ClusterIP sits static while endpoints update in real-time as new Pods land or old ones vanish during rolling updates with zero downtime windows required by SLA compliance teams. A Deployment rolling update spins up three new ReplicaSet pods before killing two old ones.
During that transition, the Service resource maps to all five containers simultaneously. One pod runs Python 3.10 with a legacy regex parser; four run Python 3.11 with compiled C extensions. The same endpoint serves both responses until the readiness probe detects all five new replicas pass their health checks at /healthz returning HTTP 200.
Readiness probes matter more than most tutorials admit. I’ve watched K3s kill misconfigured containers within 12 seconds of deployment because the TCP socket opened but the application hung on database migration. Without that probe, users hit broken endpoints for minutes instead of seconds. The analogy holds: you’d rather serve one table late than serve everyone food poisoning from an undercooked recipe version.
Volume mounts complete the picture—they’re your dry storage and walk-in cooler combined into persistent claims surviving any container restart or node failure without data loss across scheduled maintenance windows.
#
The Three Probes You Need to Know
Most Kubernetes tutorials mention health checks in passing, but the distinction between the three probe types is where real-world reliability lives. The liveness probe answers one question: is this process alive? If it fails, Kubernetes kills the container and starts a fresh one. The readiness probe answers a different question: is this process ready to serve traffic?
If it fails, Kubernetes stops sending requests to that Pod but doesn’t kill it — the container keeps running, waiting for its dependencies to catch up. The startup probe is the newest addition, designed for slow-booting applications like Java services that need 60 seconds to warm up their JIT compiler before they can handle a single request.
Here’s a real scenario I hit last month. I deployed a new version of my metrics collector that connected to a Postgres database on boot. The container started fine — the process launched, opened a TCP socket, and began initializing its connection pool. But the database was still migrating a schema change, so every connection attempt failed. The liveness probe passed because the process was alive.
The readiness probe also passed because I’d only configured a TCP check, not an HTTP check against an actual endpoint. The result: Kubernetes marked the Pod as ready, started routing traffic to it, and every request failed with a connection refused error for about 90 seconds until the migration finished.
The fix was simple: change the readiness probe from a TCP socket check to an HTTP GET against /healthz, and make that endpoint return a non-200 status until the database connection pool is fully initialized. Now Kubernetes knows the difference between “process is running” and “process can actually do its job.” That distinction is the difference between a self-healing cluster and a cluster that confidently routes traffic into a brick wall.
#
What the Scheduler Actually Considers
The scheduler doesn’t just look at CPU and memory. It evaluates a scoring function across every eligible node, considering factors like:
The scoring happens every 50 milliseconds, and the scheduler picks the highest-scoring node for each pending Pod. That’s why you’ll see Pods land on hosts you haven’t touched in months — the scheduler doesn’t care about your mental model of the cluster, only about the current resource picture.
One Analogy That Makes Everything Click
Think of Kubernetes as a restaurant kitchen. The Pods are your cooks—each one has a specific station and a recipe to follow. The scheduler is the expediter, deciding which cook handles which ticket based on who’s free and what’s urgent. The Service is the pass-through window: customers order from a single menu, but the dishes come from whichever cook is ready, and the menu never changes even when cooks swap shifts.
Now watch what happens during dinner rush. Your Node.js service idles at 5% CPU for hours, then a batch job spikes it to 85%. The Horizontal Pod Autoscaler—checking every 15 seconds—sees the ticket pileup and pulls a third cook onto the grill. When the rush ends and CPU drops below 80% for five minutes, that cook goes back to prep. No permanent second grill station needed, no idle hardware burning electricity.
The same logic applies to placement. My database pods run on different physical machines than my API servers, enforced by an anti-affinity rule. That’s the expediter never putting two bakers on the same side of a cramped line—one power supply failure shouldn’t take down both the bread and the soufflés. Meanwhile, the scheduler re-evaluates placement every 50 milliseconds, scattering containers across machines based on current CPU pressure and memory availability.
I routinely see pods land on hosts I haven’t touched in months, chosen purely because they had headroom.
Here’s the concrete payoff: in a typical setup, servers idle at 15–20 percent utilization because each hosts one service and can’t share resources. With Kubernetes, that same hardware runs multiple workloads, and the scheduler shifts them dynamically. One machine handling five services at 60 percent utilization beats five machines at 15 percent—less hardware, less power, fewer failure points.
The restaurant closes, but the cluster doesn’t. While human managers review tomorrow’s prep list, the scheduler keeps reconciling reality toward intent: three replicas running, health checks passing, traffic routed to the cooks who are actually ready. That’s the whole story. The YAML, the kubectl commands, the sync periods—those are details for your terminal, not your pitch meeting. One clear comparison beats ten precise numbers every time.
Common Mistakes That Undermine Your Cluster
I’ve seen more Kubernetes adoption fail from bad habits than from the technology itself. Here are the four mistakes that show up in almost every cluster I’ve audited.
Mistake 1: Setting CPU requests too high. If you request 2 full cores but your service typically uses 0.3, the scheduler reserves 2 cores on a node that could host six other workloads. You’ve recreated the exact utilization problem Kubernetes was supposed to solve. Start with requests that match your steady-state usage, not your peak. Let the scheduler pack more workloads onto each node.
Mistake 2: Ignoring memory limits. Containers without memory limits can consume the entire node’s RAM, triggering the OOM killer and taking down unrelated Pods. Set limits that are 20–30% above your expected peak, and watch your metrics for a week to calibrate. The worst outage I’ve seen in a K3s cluster happened because a single container leaked memory until the kernel killed every process on the node.
Mistake 3: Using latest tags in production. When you deploy with image: myapp:latest, you can’t reproduce a previous state. The image digest changes every time you push, and rolling back means guessing which tag corresponds to which commit. Use semantic versioning or commit hashes as tags, and pin them in your deployment manifests. Your future self will thank you when you need to roll back a bad release at 3 AM.
Mistake 4: Skipping resource quotas at the namespace level. Without quotas, one team can deploy a Pod that requests 32 GB of RAM and starve every other workload on the cluster. Define ResourceQuota and LimitRange objects per namespace so each team operates within boundaries. This isn’t bureaucracy — it’s the difference between a shared cluster and a tragedy of the commons.
What To Look For When Evaluating Kubernetes Distributions
If you’re considering Kubernetes for your own infrastructure, the distribution choice matters more than most people think. Here’s what I look for when evaluating options like K3s, MicroK8s, k3d, or full upstream Kubernetes.
Installation complexity. Can you get a working cluster in under 15 minutes? K3s ships as a single binary and boots a cluster with one command. MicroK8s uses snap packages and includes add-ons for common services like DNS and ingress. Upstream Kubernetes requires kubeadm or a managed offering like EKS or GKE. If setup takes more than an afternoon, you’ll never maintain it.
Resource footprint. K3s runs comfortably on a Raspberry Pi 4 with 4 GB of RAM. MicroK8s needs a bit more headroom. Full Kubernetes expects at least 2 GB per node just for control plane components. If you’re running on bare metal at home, the lightweight distributions are the difference between a cluster that fits in your homelab and one that needs a dedicated rack.
Upgrade path. How do you update the Kubernetes version? K3s has a built-in upgrade mechanism that handles the control plane and worker nodes with a single command. MicroK8s uses snap refresh. Upstream requires manual upgrades of each component. The easier the upgrade path, the more likely you’ll actually stay current with security patches.
Storage integration. Does the distribution include a default storage class? K3s ships with local-path provisioner, which gives you persistent volumes backed by local disk. MicroK8s includes a hostpath provisioner. Upstream Kubernetes expects you to bring your own CSI driver. For a home lab or small production setup, built-in storage is a huge time saver.
Community and documentation. K3s has an active community and excellent docs, plus a massive install base from edge computing projects. MicroK8s benefits from Canonical’s support and integration with their other tools. Upstream has the broadest ecosystem but also the steepest learning curve. Pick the one where you can find answers to your specific questions without wading through generic tutorials.
Keep Reading
- From Ticket Chaos to Code Merged: AI Agent Halves Dev Cycle Time
- How to Orchestrate 10+ AI Coding Agents in Parallel – Each Opens a PR
- NVIDIA KAI-Scheduler: From GPU Chaos to MLOps Competitive Moat
My recommendation for most small teams and homelab operators: start with K3s. It’s production-grade, lightweight, and the single-binary install means you can tear it down and rebuild it in minutes when you break something during experimentation. That’s exactly the kind of infrastructure that encourages learning instead of punishing it.